Project 1 Benson
Projects ·First Week of Metis!
It’s the first week of Metis and we are starting it off on a Tuesday due to Martin Luther King’s holiday. Although everyone out there (not in the bootcamp) are rejoicing for the day off, I know what this really means… We will have to cram five days of material into four and have one less day to work on our project which is still due on the same Friday. As expected the first week started as intense as I expected and the shorter time span made this even more so.
So let the fun begin… Project 1 Benson
We received an email from WomenTechWomenYes asking our team to use the power of analytics to help optimize the effectiveness of their street teams’ promotion of their annual event gala scheduled to occur early summer. These street teams will be located near subway stations to pass out flyers to patrons where they can receive free tickets to the gala. The goal of the gala is to increase women’s interest in technology and fundraise for scholarships.
Our task is to identify the optimal subway stations to place these street teams to increase attendance to the gala and maximize the likelihood of donations to the organization.
There are a couple of assumptions we made before proceeding to our analysis. We assumed the gala event would occur in mid June of 2018. Therefore it made the most sense to analyze the MTA data three months prior to the event. We decided to analyze data from March through the first week of June and went back to 2015 to further increase the accuracy of the statistics. In addition we are assuming the street teams are able to cover 10 stations.
The target audience are people who hold a degree, as this can be a strong indicator that they are interested in technology. We are not only interested in filling up the seats to the gala but to fill it up with wealthy donors to donate to the cause. Therefore we are targeting wealthy individuals making at least six figures. Furthermore we are looking for people between the ages of 25 – 65. We thought this was a reasonable age range where people would either be already starting their careers in technology and are wealthy enough to donate.
Approach
We had to use New York’s MTA Turnstile data as our base point in our analysis which is free and available online.Luckily the data was very clean and easy to understand. The essential numbers to our analysis is analyzing the total foot traffic which is the sum of entries and exits. The entries and exits were cumulative so we had to make sure to calculate the total foot_traffic at that time of day.
We were also able to attain data of median household income, education attainment, and household totaling 200K from people between 25-65.
Since we are including multiple metrics in determining the optimal subway station, we decided to create an algorithm to calculate the ‘station value’ where we assigned different weights to each metric. We weighed foot traffic 50%, income and age 20%, and education attainment 30%.
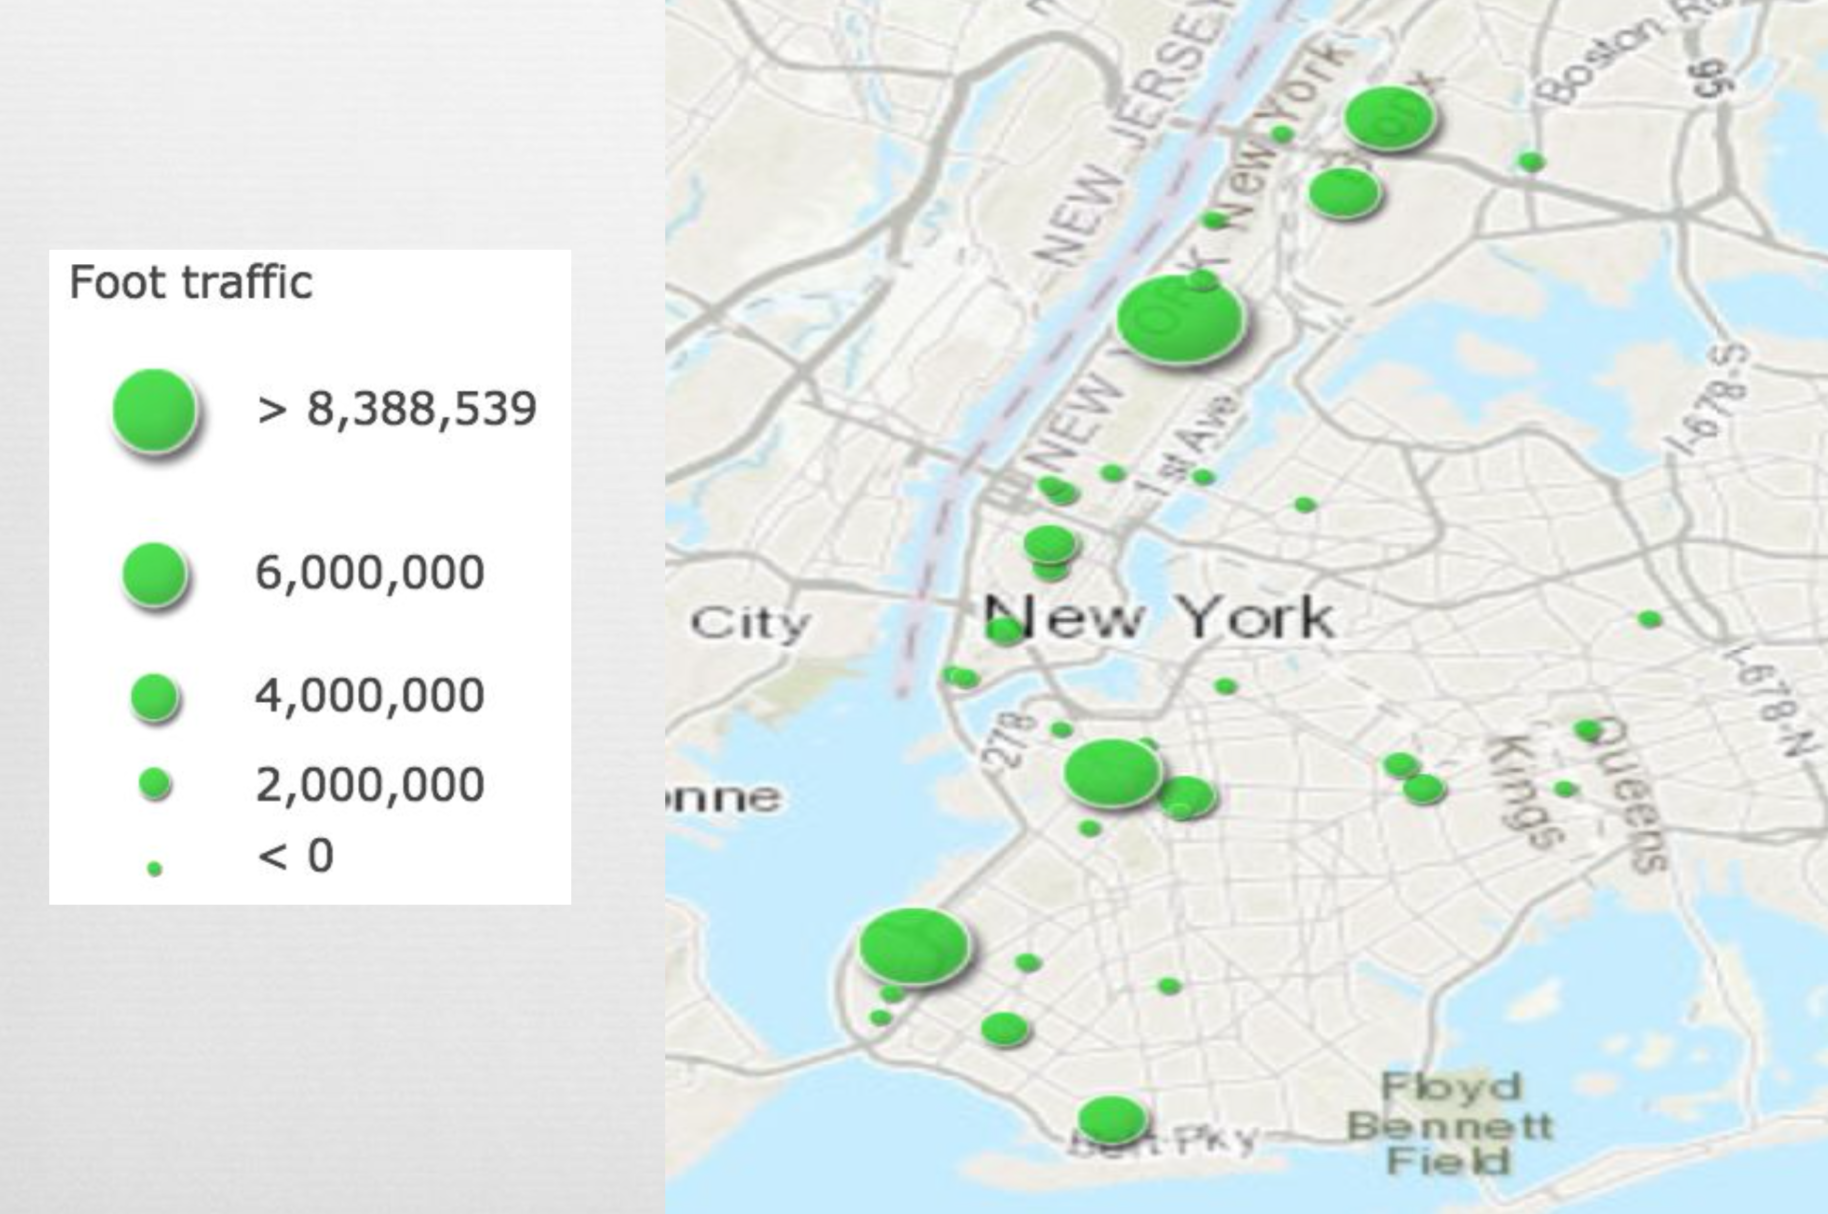
Due to the locational aspect of this project, I was able to use ArcGis to map out the locations of the stations. We mapped out each station with different size bubbles with respect to its foot traffic. There were three stand out stations with the most traffic: 116th Street, 59 Street, and Wall Street.
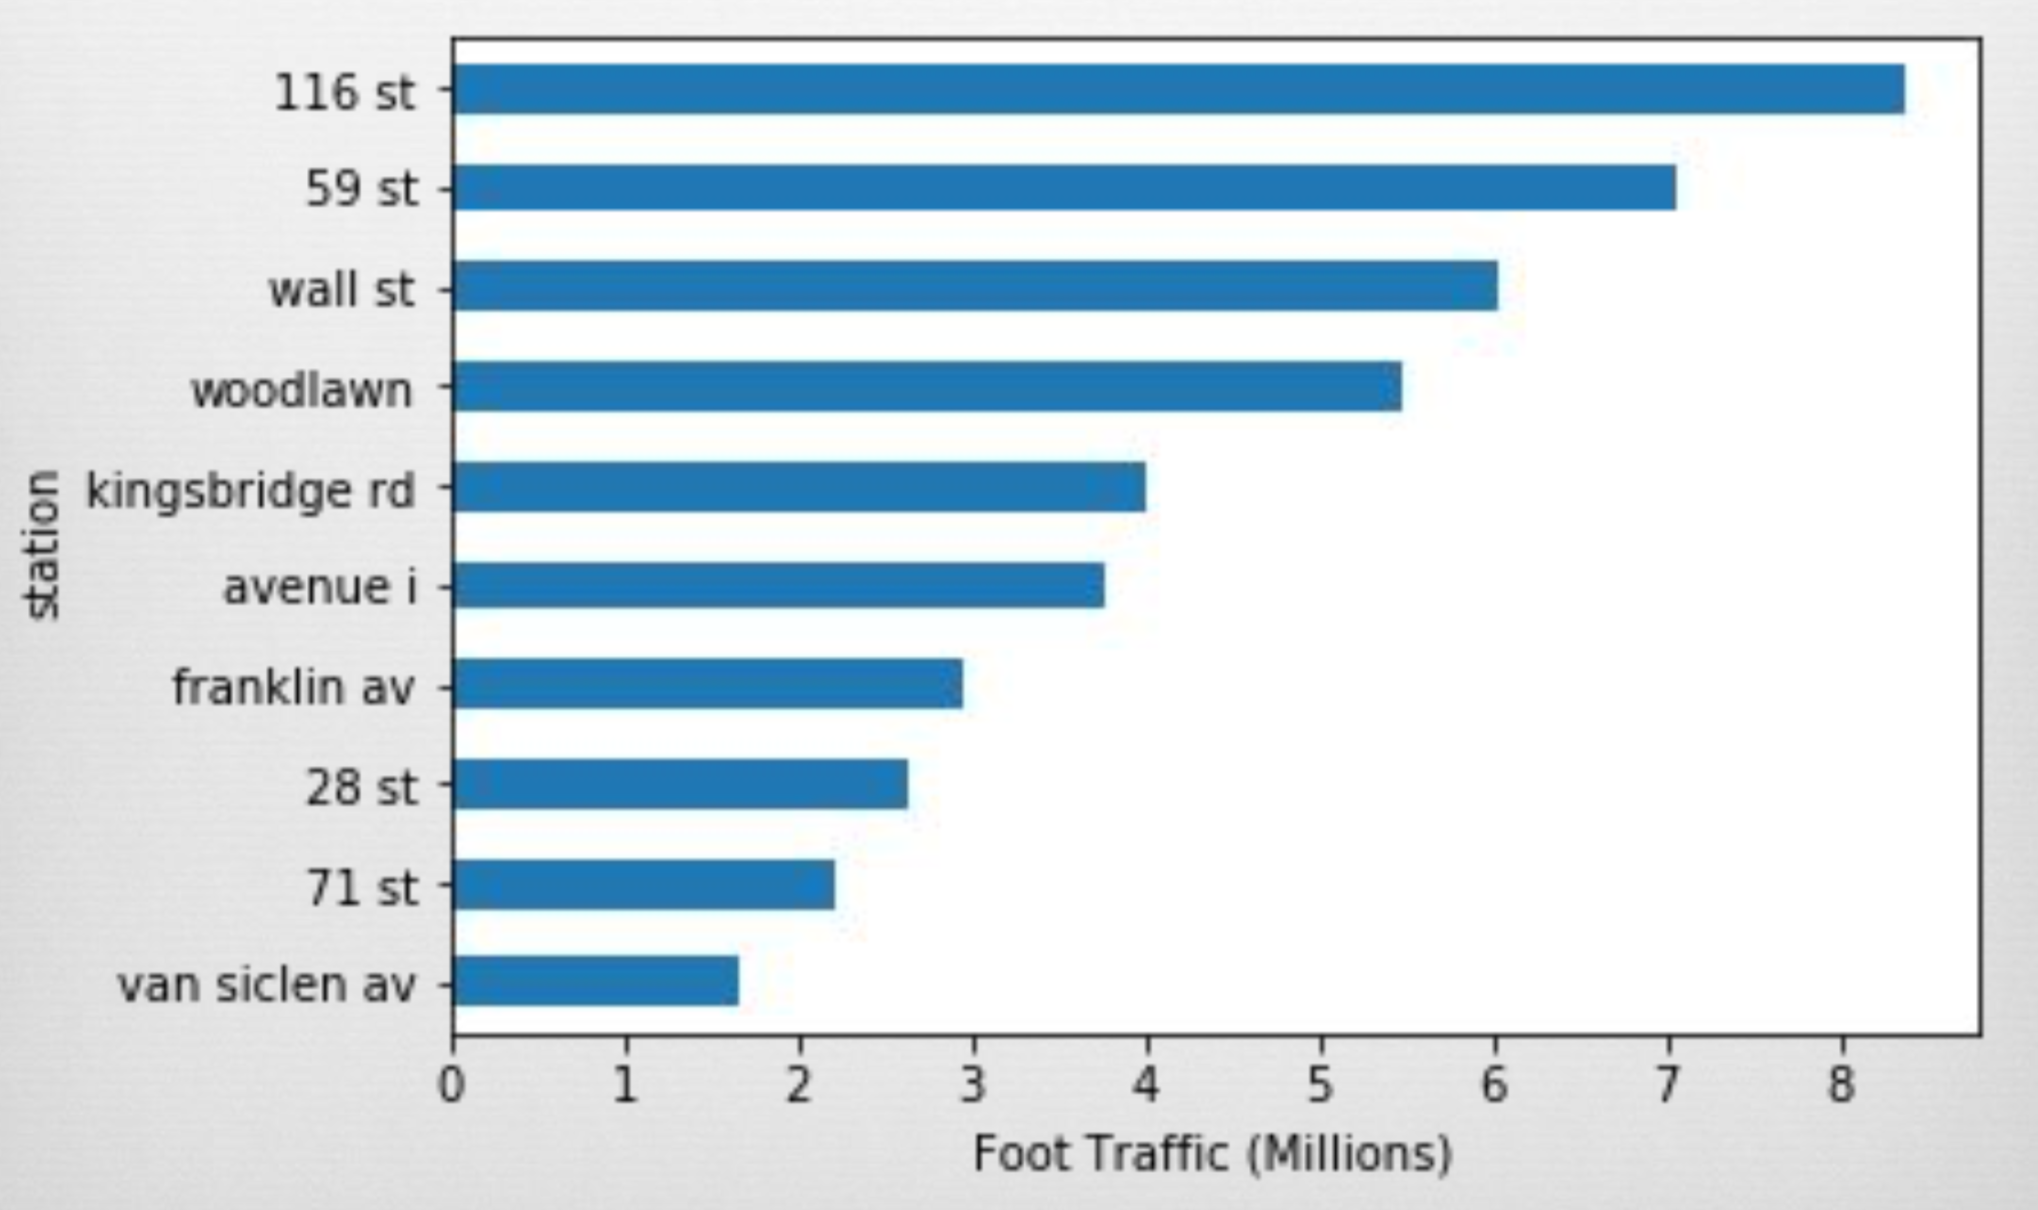
A horizontal bar chart was supplemented with the map to show the top 10 stations with the most foot traffic. We followed this similar analysis with each metric.
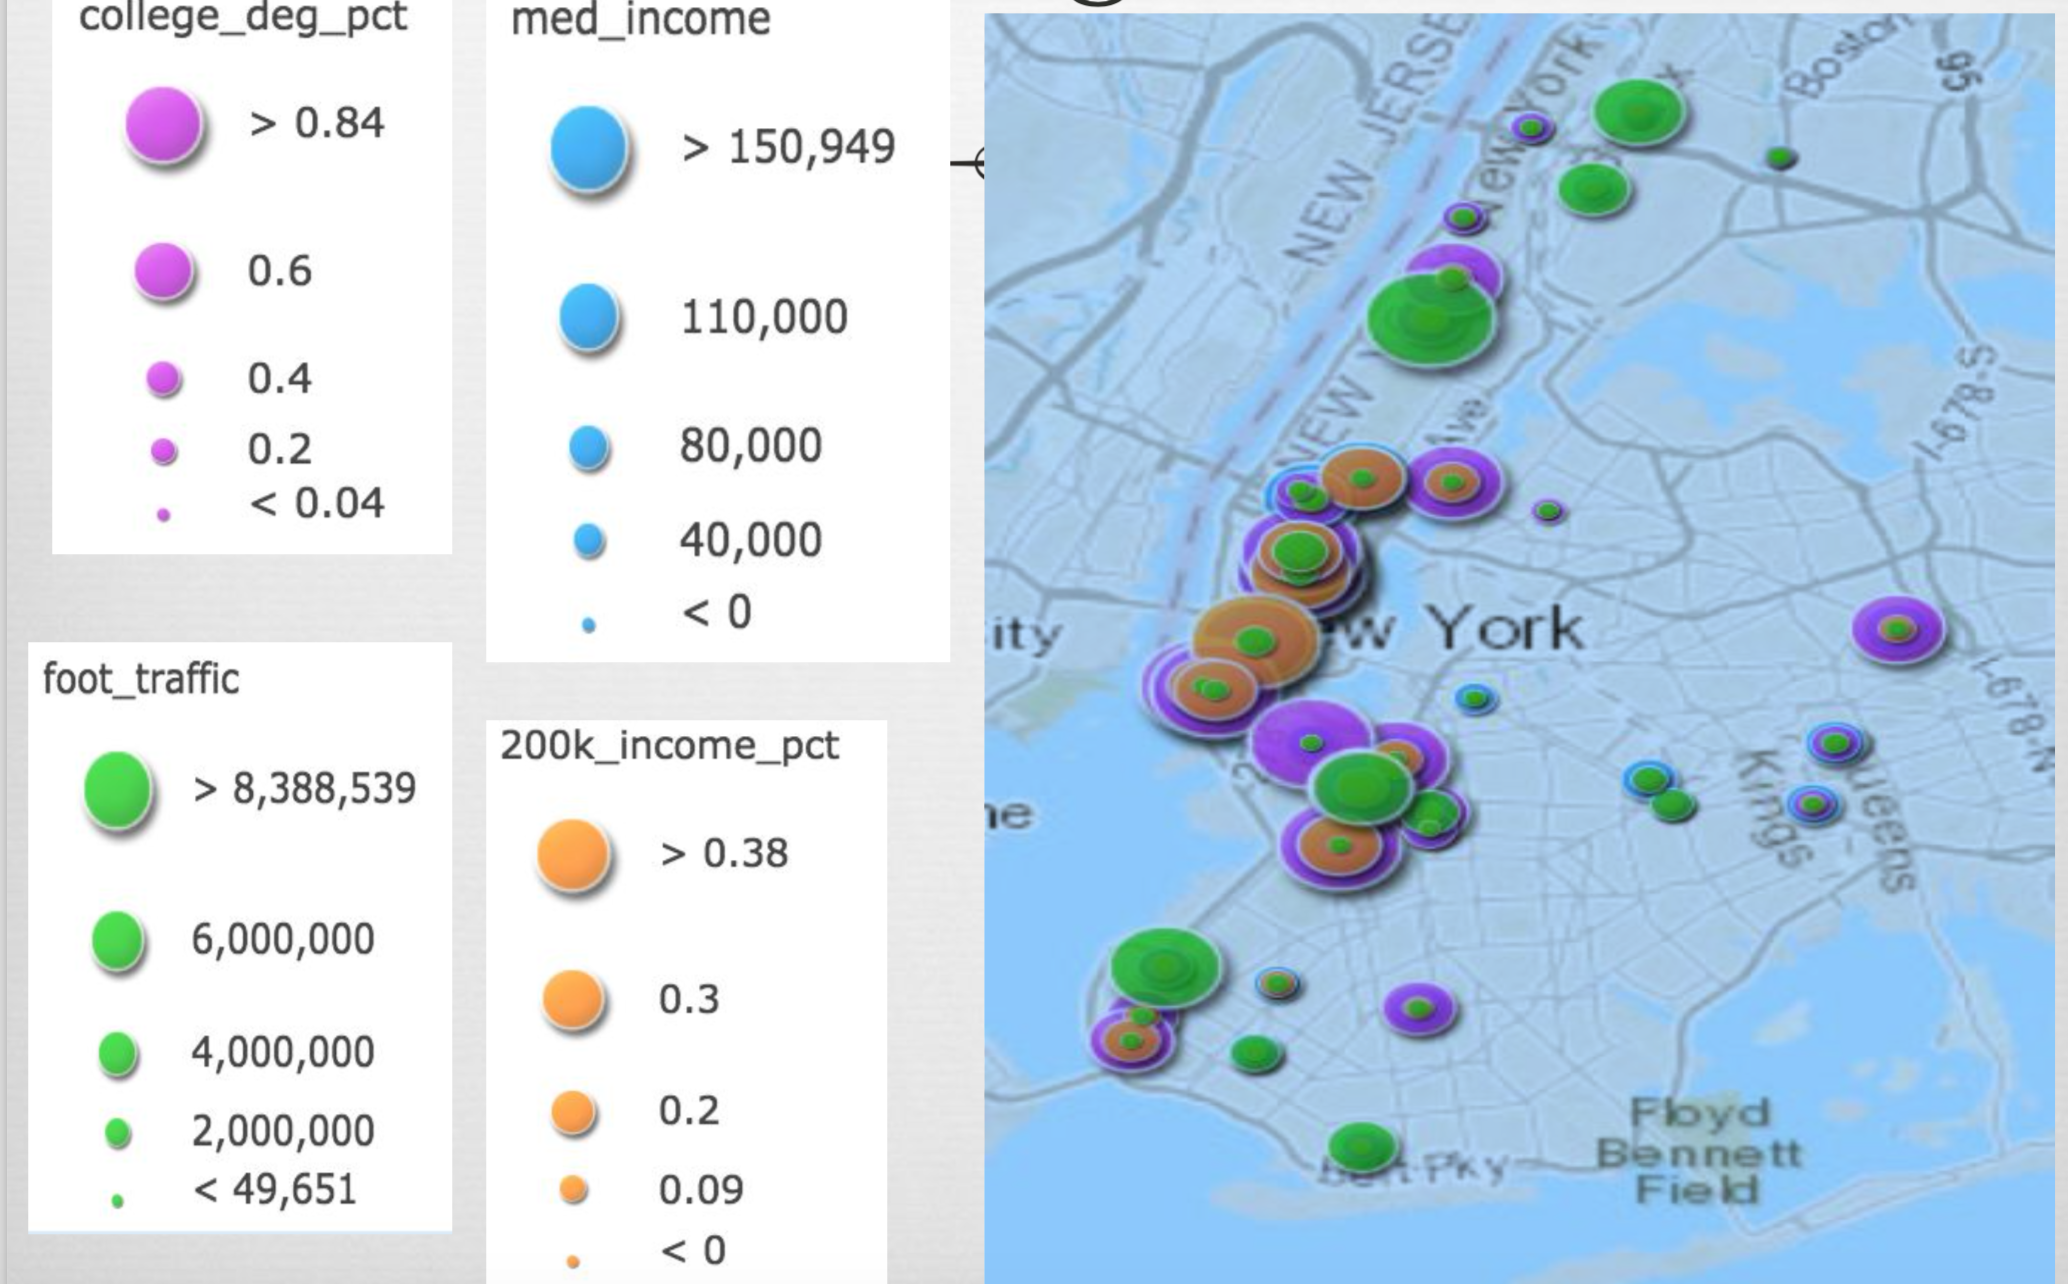
It was pretty cool and informative when I overlapped all of the metrics onto one map so we could see which station had the most overlap.
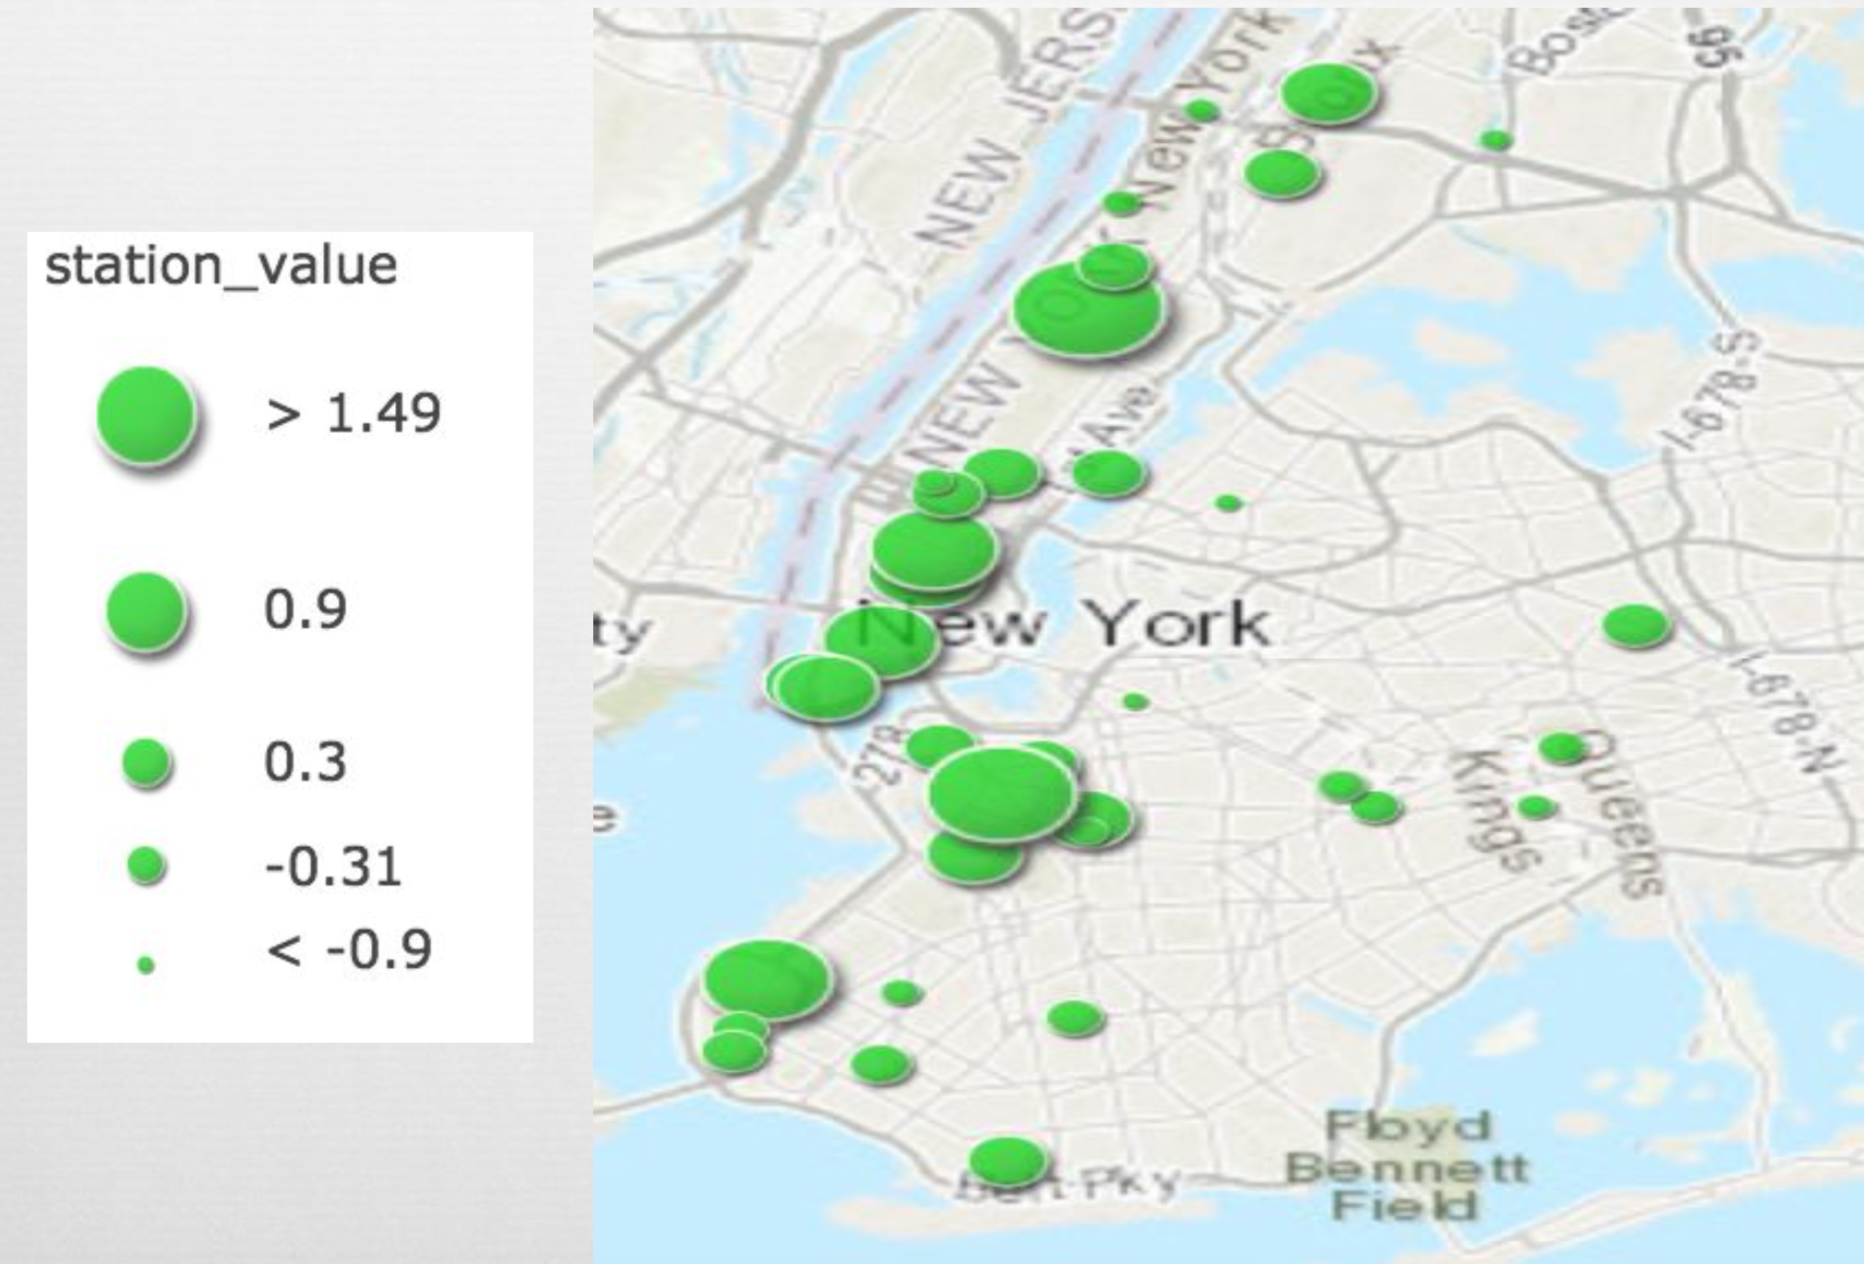
However the map did look a bit busy so we also provided a map of each station by its station value. The map looked considerably clearer in determining which station were the most optimal. We were able to provide the top 10 stations with the highest scores.
If we had more time to work on the project we would have loved to incorporate more metrics to better capture our target audience. The NAICS has a technology sector code denoting the percent of people in technology related fields. This would have been very helpful in locating people that are interested in technology. Furthermore we could have used data of people holding computer science, math, and engineering degrees. These two datasets would have greatly improve finding people to attend and donate to the WYWT organization.