Project 3 McNulty
Projects ·I am rapidly approaching the half way mark at Metis. Time has flown faster than expected. Time flys when you’re having fun and working ever so diligently on producing your first portfolio of data science projects.
I decided to predict the classification of H-1B visa petitions for my third project at Metis. I was capitvated to this topic because I have several friends who are working in the United States with a H-1B visa. The H-1B is a non-immigrant visa that allows US employers to temporarily employ foreign talent for specialty occupations. It is the responsibility for the employer to submit the H-1B petition. The government sets the cap of visas to 65,000. When that cap is surpassed, the certified petitions will enter a random lottery to be selected for a H-1B visa. Therefore I will solely be predicting whether the H-1B petition will be certified or denied and not the actual granting of the H-1B visa.
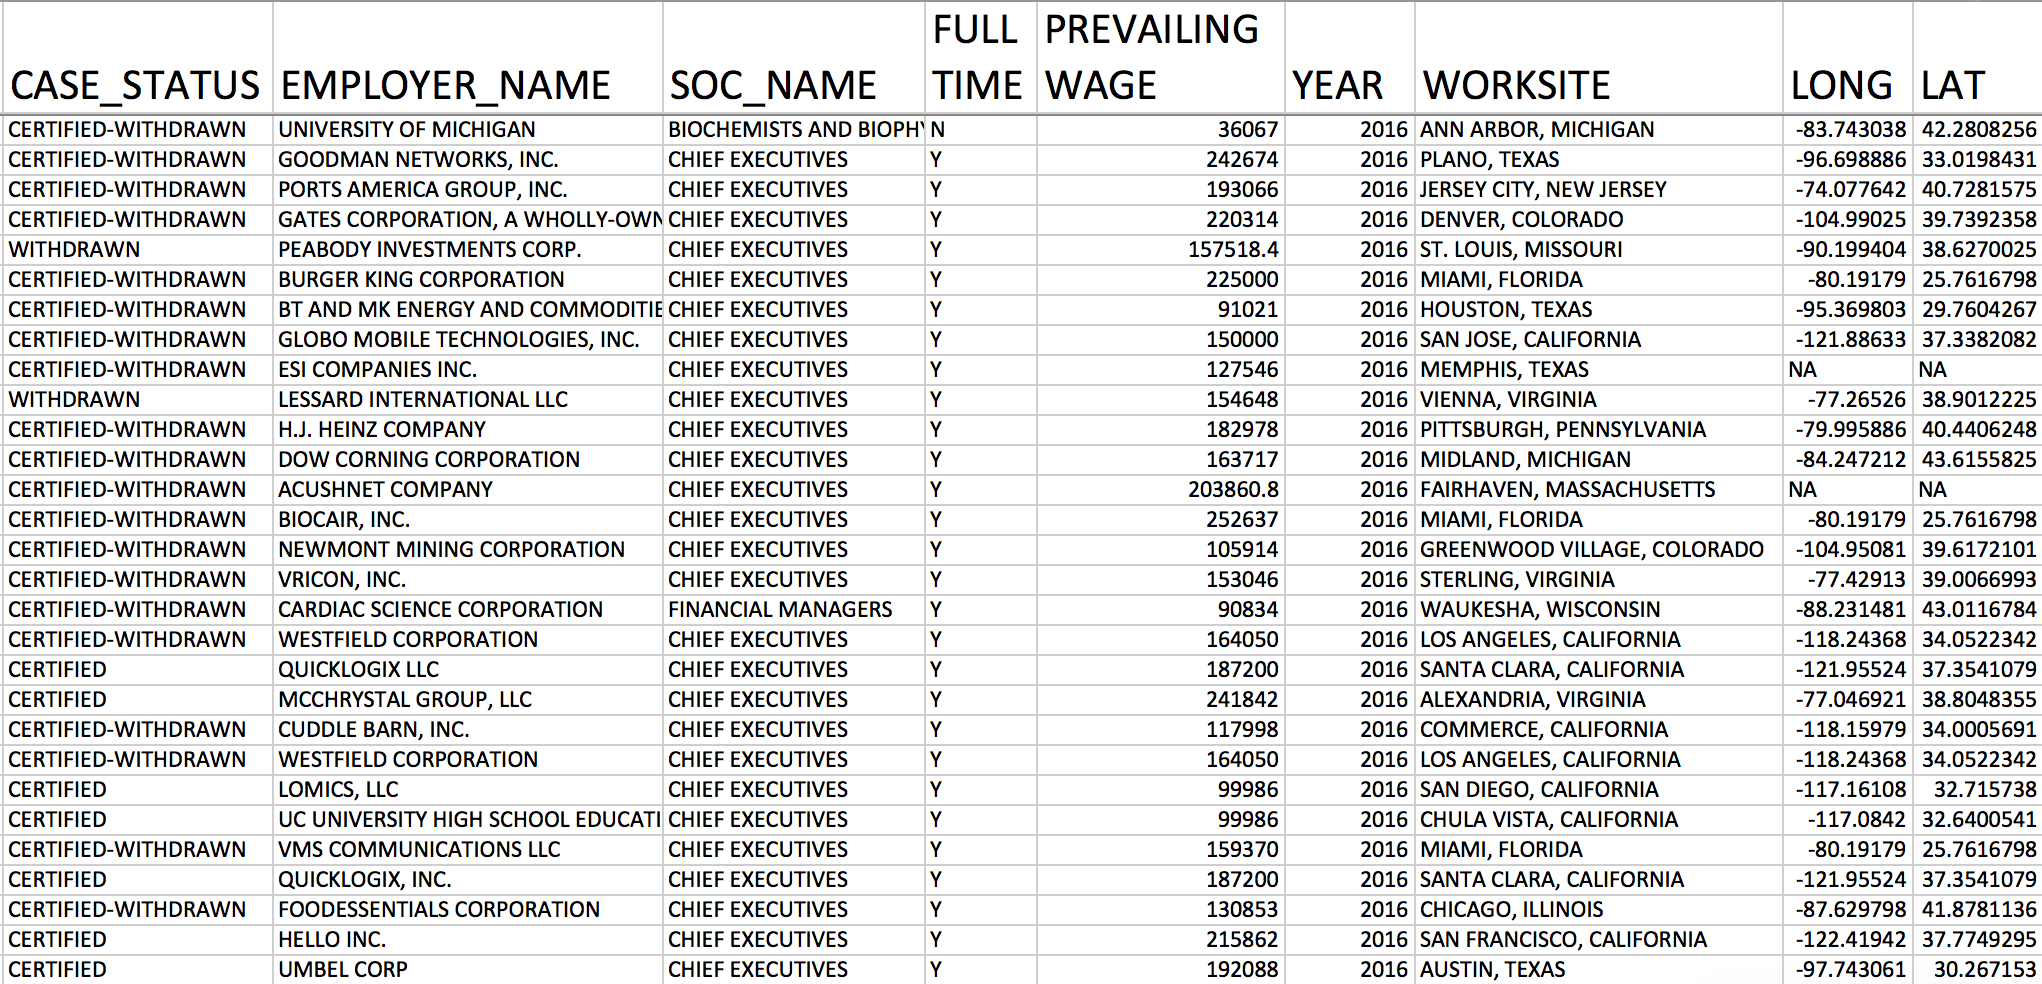
I retrieved my dataset from Kaggle which can be seen below. It includes the case status: certified and denied. I had over 220K of unique employer names and over 1500 unique standard occupational codes. It would have taken too much computation power to convert the features as dummies so instead I transformed the features by finding the certified rate and total petitions submitted by employer name and occupational code. Further more I had to extract the state from worksite and convert it into dummies. My data set included prevailing wage, full time position, and the petitions from 2011 – 2016.
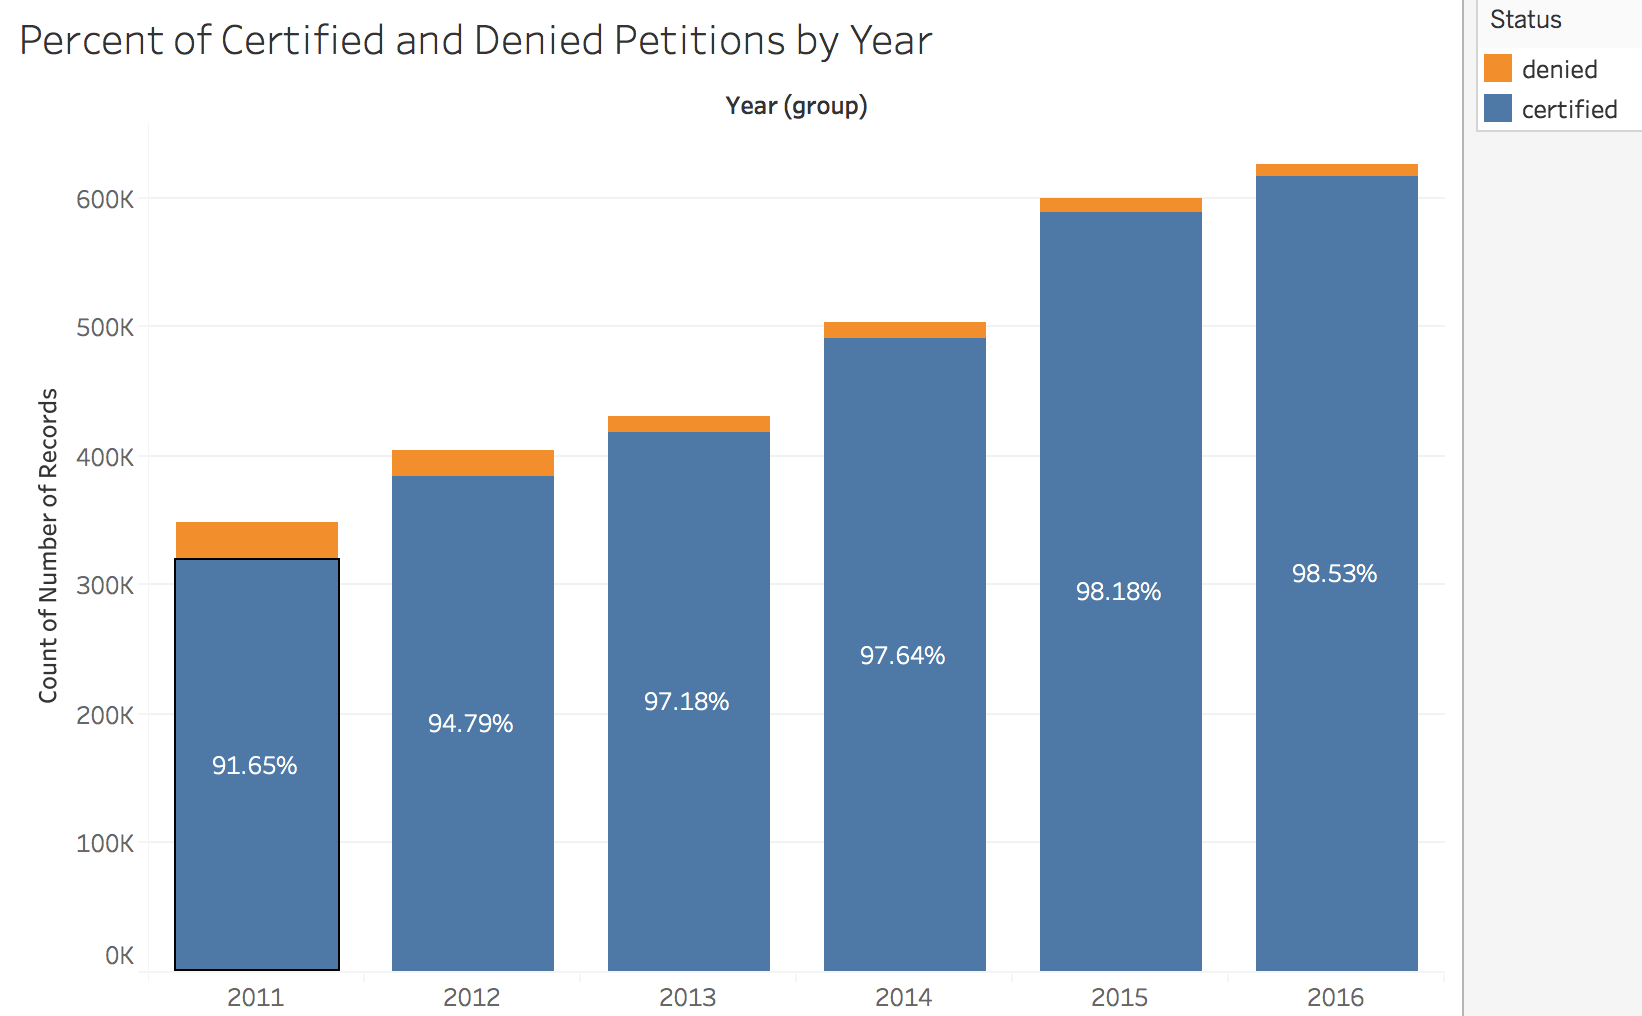
As you can see the data set is very imbalanced, I have 97% of my data is made up of certified petitions. I will later go back and explain how I resolved this when building my models. Another thing you’ll notice as the years move forward the number of denied petitions decreases. This is a strong indicator that year will be an important feature in helping the model classify the petitions.
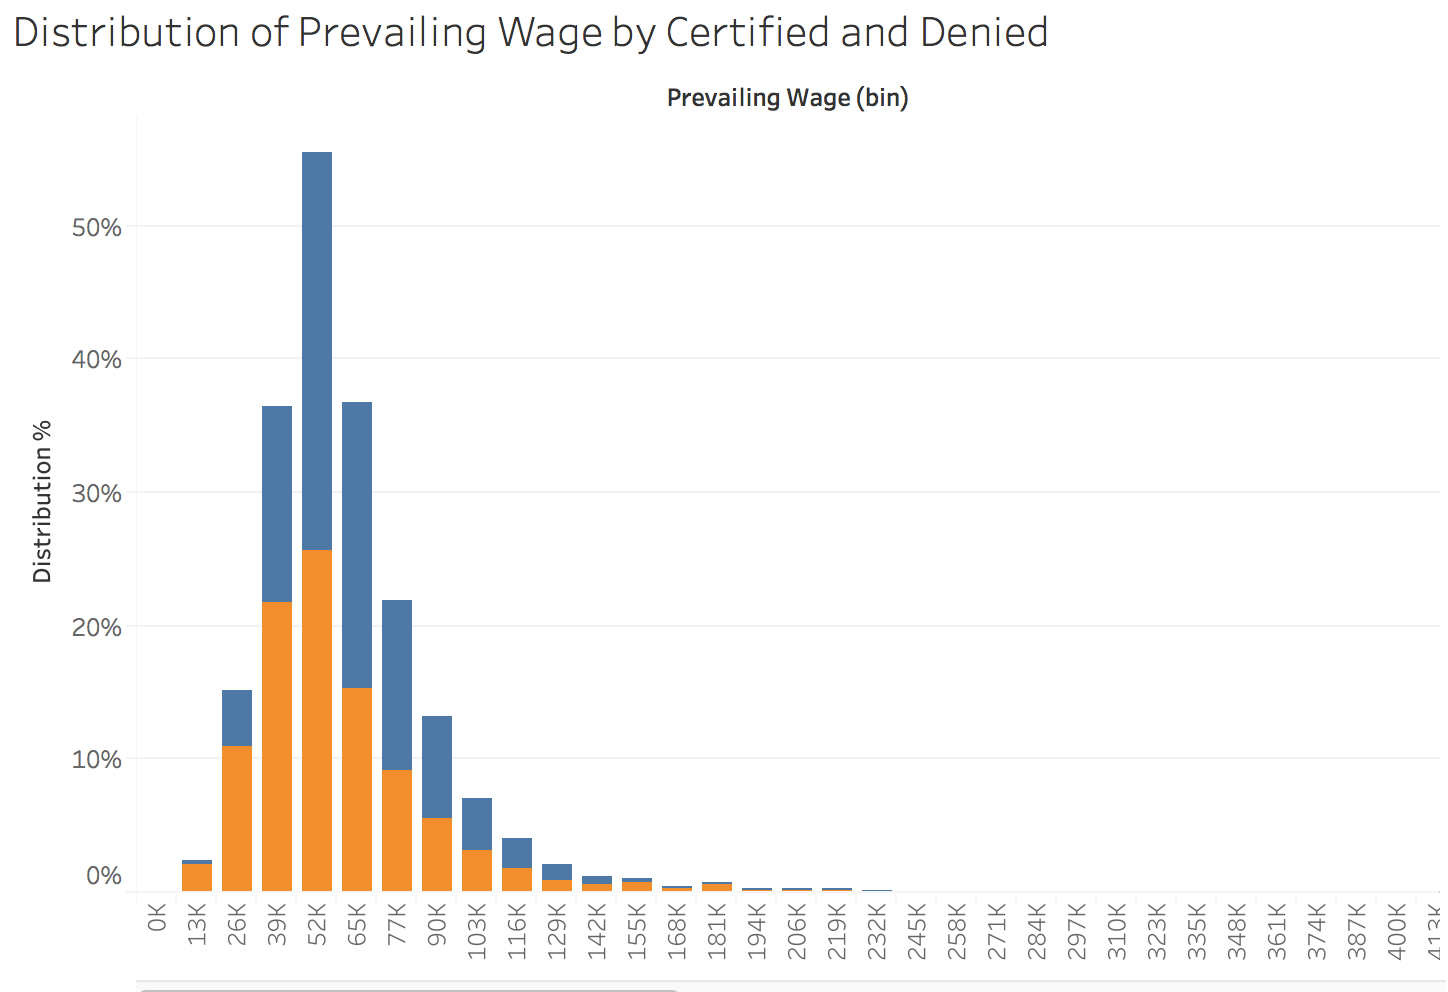
I plotted the distribution of prevailing wage by denied and certified petitions, we can see that this will not be a strong feature as they over lap a lot but we can still see that as the wage goes down the denied rate increases and certified rates have higher wages.
These are the top 50 Employers submitting the most H-1B certified petitions. 80% of these petitions are for computer related jobs.
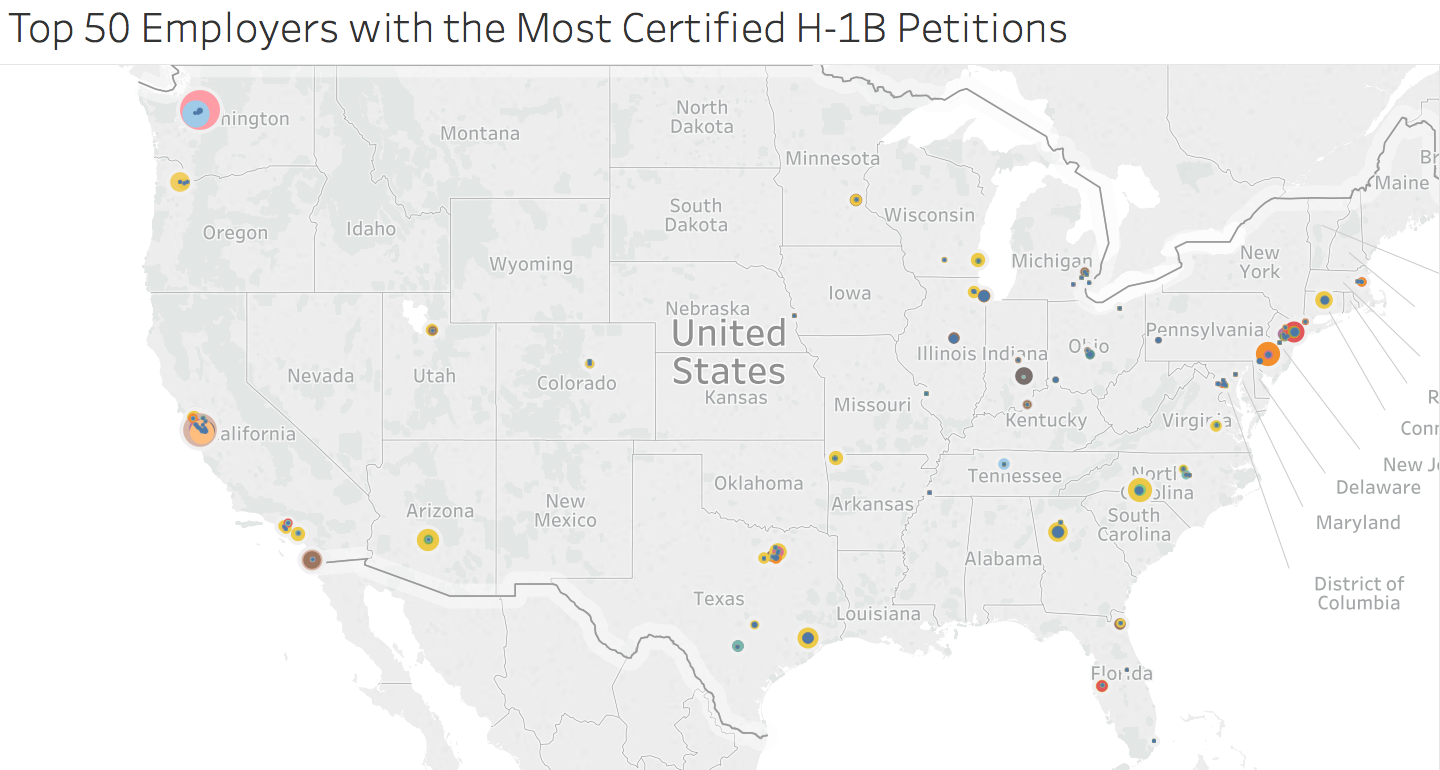
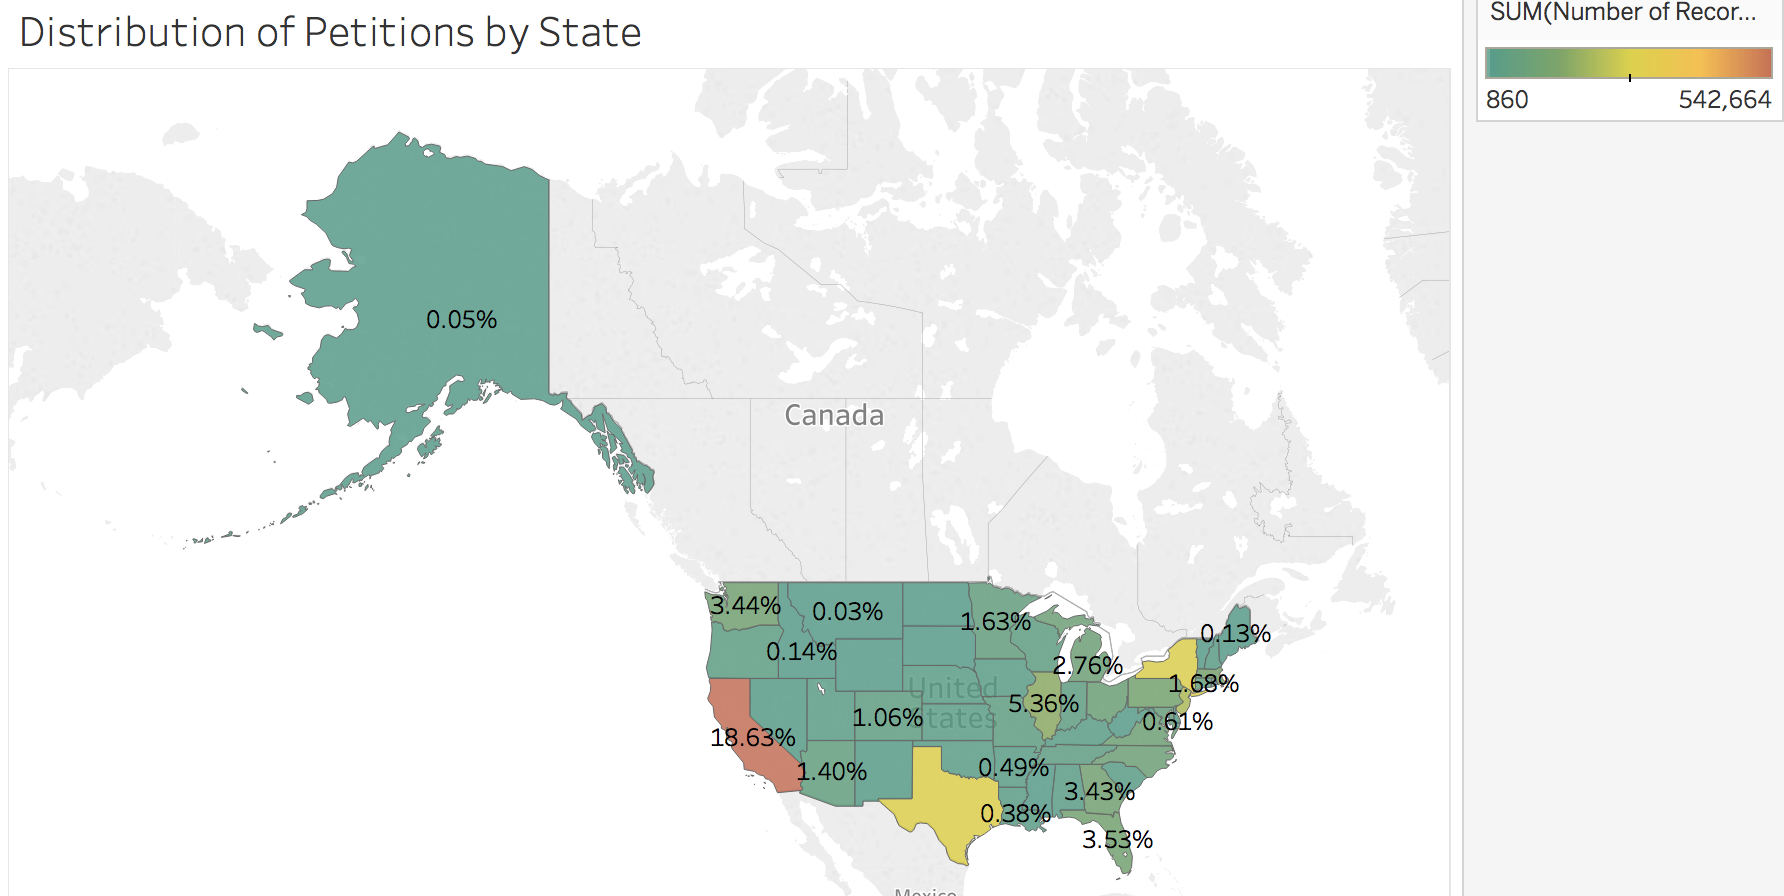
Lastly this is the distribution of petitions by state. California is the leading petitioner at 18%, followed by Texas and New york. Washington is at 3%. All states with big tech hubs.
Before I could begin modeling I had to address the unbalanced classes. I was curious in what would give the better results in terms of downsampling and using class weight and using both. Here is my control group where I did neither.
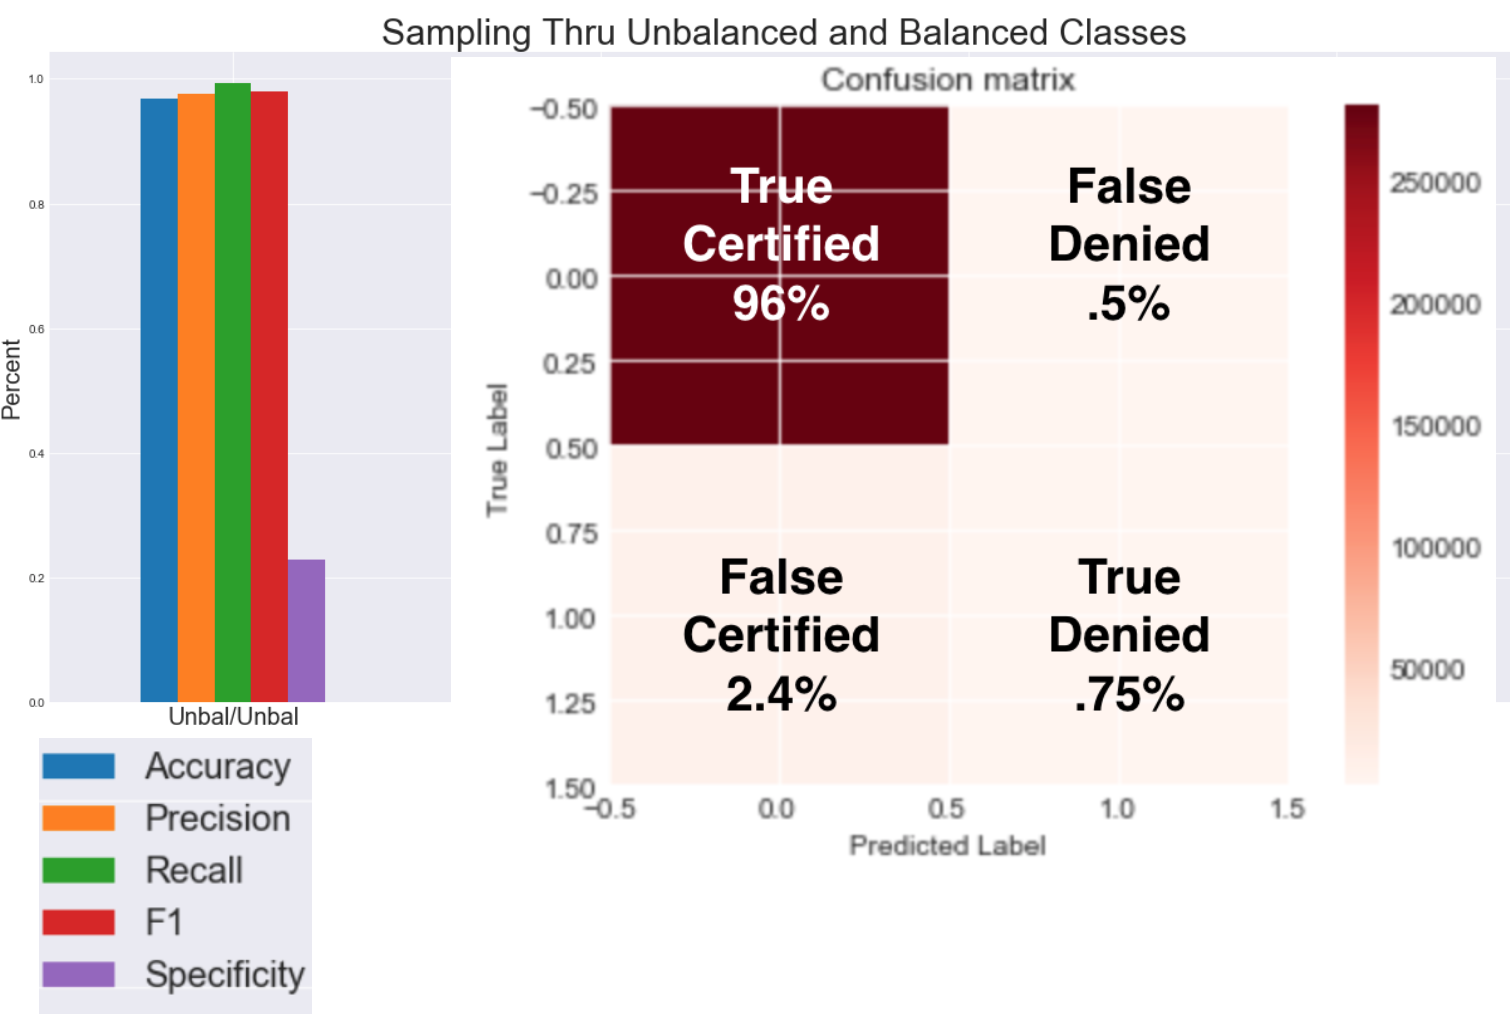
The accuracy rate which is the percent of predictions that are correct is almost 1 and this makes sense b/c 96% of my data is made up of certified petitions. Precision which is the percent of positive predictions were correct and the recall which is the percent of positive cases the model caught is also almost 1 and again this makes sense. F1 score is just as high because it’s the harmonic mean of the recall and precision. Looking at these numbers you can easily be deceived and think the model is amazing until you consider specificity measure which is the percent of negative cases the model caught which is at only 23%. This really shows the importance of balancing the classes. The next data set I downsampled the certified class and did not use class weight. The accuracy to f1 score did take a hit but specificity nearly triples. In this case we are decreasing type I errors. Ultimately just using class weight and not downsampling produced the best results, as it still uses all the data available while giving more power to the minority class.
Modeling
I built my first model using logistic regression. I performed recursive feature selection with lasso regularization. It performed best with lasso because I had so many features that are likely useless such as the state dummies so lasso does a better job in eliminating those features. Here is the logit regression on the 32 features where a lot of them are significant since the p values are less than .05. Not surprisingly certified rate by employer and occupation code is significant because if you are being employed by a big time company like Amazon that employs a lot of h1b workers, your petition will highly likely get certified. As well as year which concurs with our findings in the graph we saw earlier.
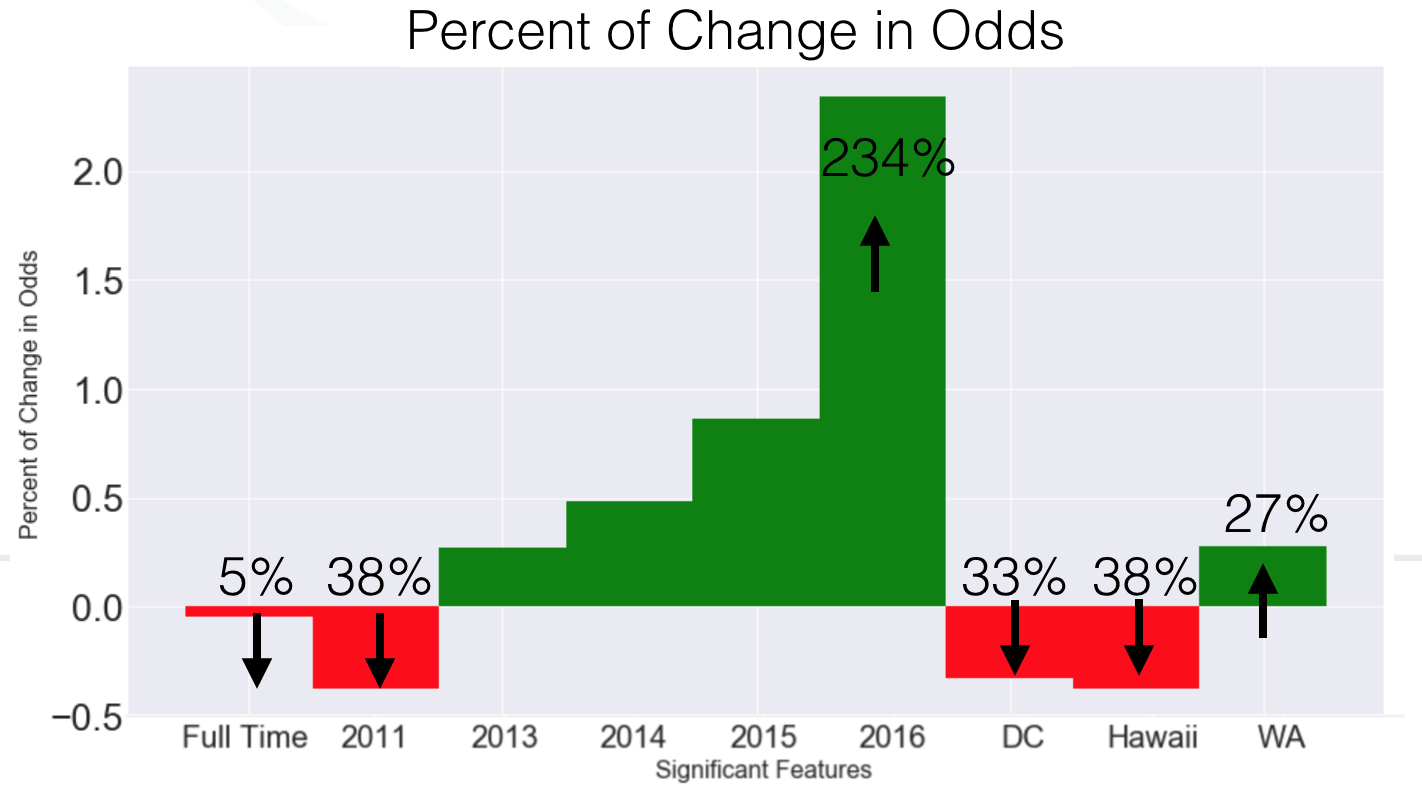
Odds Ratios
Since logit regression gives us the log odds we just have to take e of the coefficients. We can see that full time position doesn’t have much of an effect. However petitions submitted in 2011 have a 38% decrease in odds of getting certified. On the other hand, the odds increase by 234% when the petition is submitted in 2016. there is a 38% decrease in odds for petitions submitted in 2011.
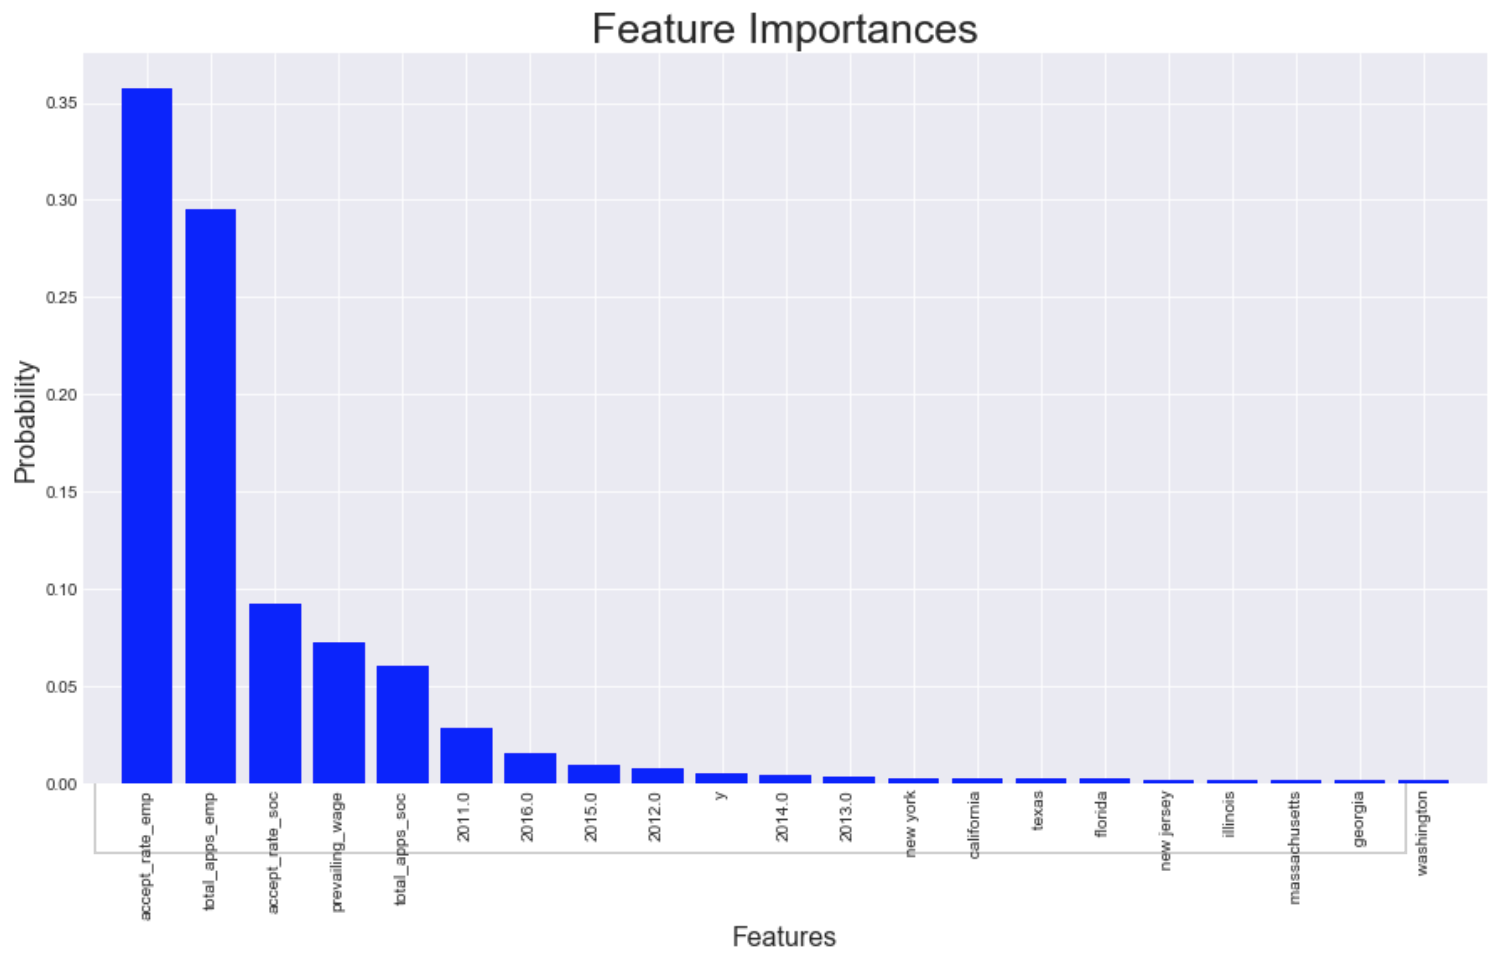
I used random forest for my second model. Forests perform implicit feature selection and provides a pretty good indicator of feature importance. As in logistic regression, certified rate by employer is the most important followed by the number of petitions by employers. Here we see all the years are very important as in logistic regression and states such as California, Texas, and New york are here too. The random forest did a better job in selecting the more significant states than LR. Forest performed better because it can capture more complex relationships such as non-linearity in the data by dividing the feature space into smaller sub spaces when LR is solely searching for a single linear decision boundary.
ROC is the receiver operating characteristic curve in which it plots out TPR and FPR at various thresholds. The AUC is the area under the curve that serves a measure of the best performing model. The diagonal represents a classifier that does no better than random guessing. RF is closest to the (0,1) point so random forest performed the best .88.
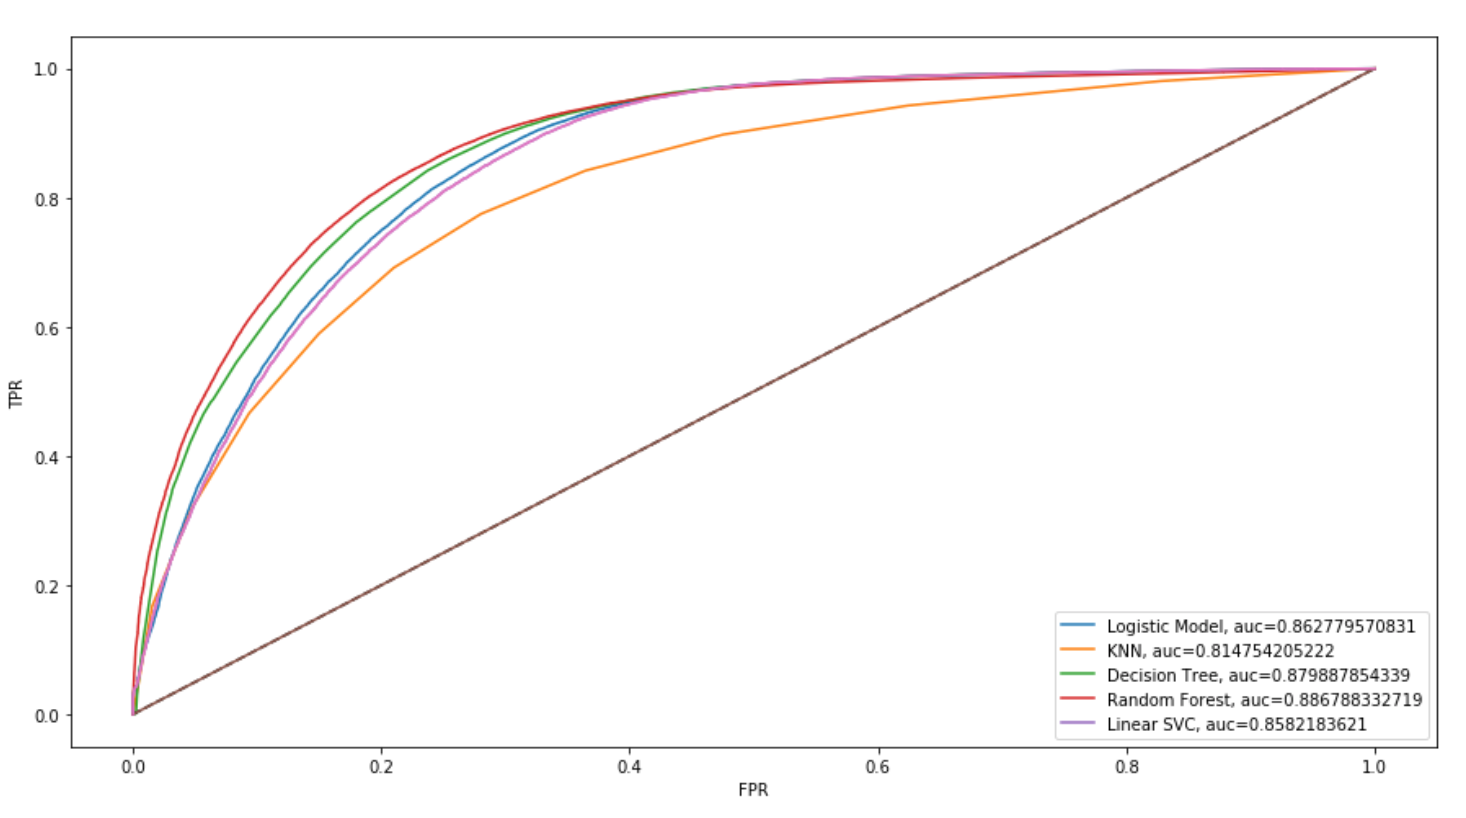
Ultimately random forest performed slightly better than logistic regression because it can capture the more complex relationships between the variables such as the non-linearity in the data. As opposed to logistic regression that is solely searching for a single linear decision boundary.